Quarkus OpenShift Quickstart – A Bonuslab for the Cloud Native Developer Workshop

Quarkus (https://quarkus.io/) – A Supersonic Subatomic Java has recently been announced from some Red Hat Developers. The idea is to build a Java runtime that is native to Kubernetes and small and fast so it can also used in serverless scenarios or on very small edge devices.

With Quarkus it is possible to create a “native” build that produces a small self-contained binary that can run in any container image.

The goal of this blog post is to provide a simple hands-on lab for Openshift to get started with Quarkus and to do something useful.

I must admit that I shamelessly build upon work done by my great colleagues, namely from Karsten Gresch from this post https://medium.com/@gresch/quarkus-native-builds-with-openshift-s2i-9474ed4386a1

The source code and the application code I got from   http://www.mastertheboss.com/soa-cloud/quarkus/getting-started-with-quarkus

Ok, lets get our hands dirty with it!

Importing the source code

I put the code in my github repository “quarkus-demo”: https://github.com/iboernig/quarkus-demo

If you are working with the Eclipse Che based cloud native workshop, make sure you are in the /projects/labs/ directory:

$ cd /projects/labs

Then clone the git repository:

$ git clone  https://github.com/iboernig/quarkus-demo.git

The quarkus-demo directory should now show up in the project explorer on the left.

Here you can left-click on that repository and convert to a maven project (same as for the other projects). This is not a necessary step, since we will not use the local maven but will use OpenShift s2i to build and deploy the application.

Examining the source code

In the src/main/java/org.acme.quickstart directory we at first the simple REST Endpoint example. It contains the class GreetingResource.java:

package org.acme.quickstart;


import javax.inject.Inject;
import javax.ws.rs.GET;
import javax.ws.rs.Path;
import javax.ws.rs.PathParam;
import javax.ws.rs.Produces;
import javax.ws.rs.core.MediaType;

@Path("/hello")
public class GreetingResource {

    @Inject
    GreetingService service;

    @GET
    @Produces(MediaType.TEXT_PLAIN)
    @Path("/greeting/{name}")
    public String greeting(@PathParam("name") String name) {
        return service.greeting(name);
    }

    @GET
    @Produces(MediaType.TEXT_PLAIN)
    public String hello() {
        return "hello";
    }
}

and the simple GreetingService.java:

package org.acme.quickstart;

import javax.enterprise.context.ApplicationScoped;

@ApplicationScoped
public class GreetingService {

   public String greeting(String name) {
      return "hello " + name;
   }
}

This will produce a simple “hello” output on the /hello URL and a short greeting with a name on /hello/greeting/<name> .

Something useful

But now we look at a little more interesting example. Lets do a simple user registration. Something that is missing in our Coolstuff store.

Lets start with the Class Person.java:

package com.sample;
 
import java.util.Objects;
 
public class Person {
 
    String name;
    String surname;
 
    public Person( ) {  }
 
    public String getName() {
        return name;
    }
    public String getSurname() {  return surname;  }
    public void setName(String name) {
        this.name = name;
    }
    public void setSurname(String surname) {
        this.surname = surname;
    }
    @Override
    public String toString() {
        return "Person{" +
                "name='" + name + '\'' +
                ", surname='" + surname + '\'' +
                '}';
    }
 
    @Override
    public boolean equals(Object o) {
        if (this == o) return true;
        if (o == null || getClass() != o.getClass()) return false;
        Person person = (Person) o;
        return Objects.equals(name, person.name) &&
                Objects.equals(surname, person.surname);
    }
 
    @Override
    public int hashCode() {
        return Objects.hash(name, surname);
    }
}

And an endpoint to safe this into a collection. RESTEndpoint.java:

package com.sample;
 
import java.util.Collections;
import java.util.LinkedHashMap;
import java.util.Set;
 
import javax.ws.rs.Consumes;
import javax.ws.rs.DELETE;
import javax.ws.rs.GET;
import javax.ws.rs.POST;
import javax.ws.rs.Path;
import javax.ws.rs.Produces;
import javax.ws.rs.core.MediaType;
 
@Path("/persons")
@Produces(MediaType.APPLICATION_JSON)
@Consumes(MediaType.APPLICATION_JSON)
public class RESTEndpoint {
 
    private Set<Person> persons = Collections.newSetFromMap(Collections.synchronizedMap(new LinkedHashMap<>()));
 
    @GET
    public Set<Person> list() {
        return persons;
    }
 
    @POST
    public Set<Person> add(Person person) {
        System.out.println("Saving: " +person);
        persons.add(person);
        return persons;
    }
 
}

Note: The files are already in the repository. This is just for a review.

 Adding an UI

Adding HTML UI is also quite easy with quarkus. Lets turn to the src/main/resources/META-INF/resources/ directory. Here you can find the following HTML code (with AngularJS for displaying the data) in the index.html:

 <!doctype html>
<html>
<head>
    <meta charset="utf-8"/>
    <title>Quarkus REST service</title>
    <link rel="stylesheet" href="https://cdnjs.cloudflare.com/ajax/libs/wingcss/0.1.8/wing.min.css"/>
    <!-- Load AngularJS -->
    <script src="//ajax.googleapis.com/ajax/libs/angularjs/1.4.8/angular.min.js"></script>
    <script type="text/javascript">
      var app = angular.module("PersonManagement", []);
 
      //Controller Part
      app.controller("PersonManagementController", function ($scope, $http) {
 
        //Initialize page with empty data
        $scope.persons = [];
 
        $scope.form = {
          name: "",
          surname: ""
        };
 
        //Now load the data from server
        _refreshPageData();
 
        //HTTP POST methods for add data
        $scope.add = function () {
          var data = { "name": $scope.form.name, "surname": $scope.form.surname };
 
          $http({
            method: "POST",
            url: '/persons',
            data: angular.toJson(data),
            headers: {
              'Content-Type': 'application/json'
            }
          }).then(_success, _error);
        };
 
 
        //HTTP GET- get all persons collection
        function _refreshPageData() {
          $http({
            method: 'GET',
            url: '/persons'
          }).then(function successCallback(response) {
            $scope.persons = response.data;
          }, function errorCallback(response) {
            console.log(response.statusText);
          });
        }
 
        function _success(response) {
          _refreshPageData();
          _clearForm();
        }
 
        function _error(response) {
          alert(response.data.message || response.statusText);
        }
 
        //Clear the form
        function _clearForm() {
          $scope.form.name = "";
          $scope.form.surname = "";
        }
      });
    </script>
</head>
<body ng-app="PersonManagement" ng-controller="PersonManagementController">
 
<div class="container">
    <h1>Quarkus REST Service</h1>
 
    <form ng-submit="add()">
        <div class="row">
            <div class="col-6"><input type="text" placeholder="Name" ng-model="form.name" size="60"/></div>
        </div>
        <div class="row">
            <div class="col-6"><input type="text" placeholder="Surname" ng-model="form.surname" size="60"/></div>
        </div>
        <input type="submit" value="Save"/>
    </form>
 
    <h3>Person List</h3>
    <div class="row">
        <div class="col-4">Name</div>
        <div class="col-8">Surname</div>
    </div>
    <div class="row" ng-repeat="person in persons">
        <div class="col-4">{{ person.name }}</div>
        <div class="col-8">{{ person.surname }}</div>
    </div>
</div>
 
</body>
</html>

Now its time to get it running!

Let OpenShift do its work!

First of all, make sure that you are still logged in with the right user into OpenShift:

$ oc whoami
user1

Now check that you are in the right project

$ oc project
coolstore-01

(If you trying this outside the cloud native workshop, simple make sure that you have a project and are logged in into OpenShift).

The Quarkus S2i (Source-to-image) builder image is not yet a part of OpenShift by default, but it is available as a builder image on quay.io and needs to be called directly:

$ oc new-app quay.io/quarkus/centos-quarkus-native-s2i~https://github.com/iboernig/quarkus-demo.git --name=quarkdemo

Now OpenShift starts a build process and you can follow the progress here:

$ oc logs -f bc/quarkdemo

This is progressing quite slow and in the normal workshop scenario it finally stops and fails. Can you tell why?

Compiling to native needs a lot of resources and each project has limits. Either increase the limit yourself (if you are a cluster-admin) or talk to you instructor. He can help with increasing or removing the limit.

Ok, lets go for the next try. Restart the build:

$ oc start-build bc/quarkdemo

Now it progresses much faster and the ready built image is pushed to the local registry.

look for the upcoming pods:

$ oc get pods 
NAME                READY     STATUS      RESTARTS   AGE
quarkdemo-1-626xd   1/1       Running     0          2s
quarkdemo-1-build   0/1       OOMKilled   0          5m
quarkdemo-2-build   0/1       Completed   0          5s

Its running! And you also can see, why the first build failed!

Now expose the service and get a route:

$ oc expose svc quarkdemo
route.route.openshift.io/quarkdemo exposed
$ oc get routes
NAME        HOST/PORT                                                   PATH      SERVICES    PORT       TERMINATION   WILDCARD
quarkdemo   quarkdemo-<project>-<serverurl>   quarkdemo  8080-tcp                 None

Now you can look at the URL in your browser:

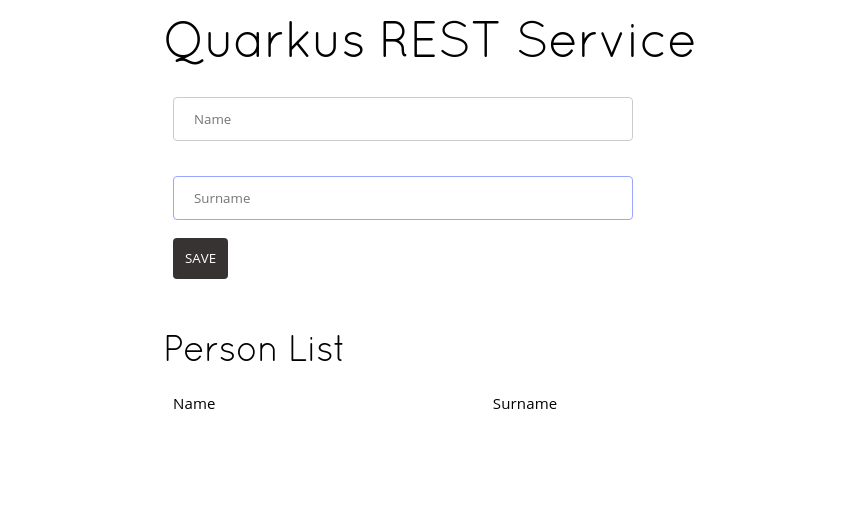
You can add names ad see what happens!

Also the simple rest service works with this binary:

$ curl http://<route>/hello
hello
$ curl http://<route>/hello/greeting/ingo
hello ingo

Very nice. But what makes Quarkus so special?

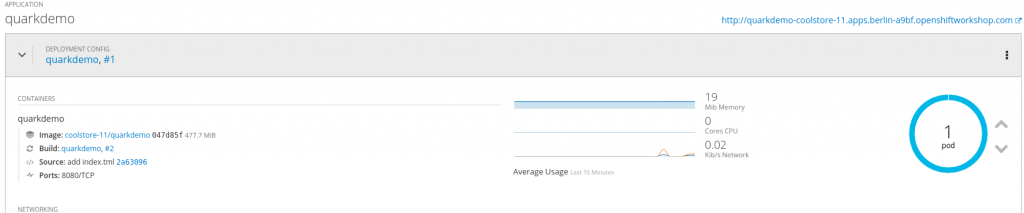
Its very small. Only 19 MB. And it doesn’t use a JVM to run: its just a simple binary:

$ oc get pods
NAME                READY     STATUS      RESTARTS   AGE
quarkdemo-1-626xd   1/1       Running     0          2h
quarkdemo-1-build   0/1       OOMKilled   0          3h
quarkdemo-2-build   0/1       Completed   0          2h
$ oc rsh quarkdemo-1-626xd
sh-4.2$ ls -lh
total 22M
-rwxr-xr-x. 1 quarkus    root 22M Apr  8 14:38 quarkus-quickstart-1.0-SNAPSHOT-runner
-rw-r--r--. 1 1000660000 root 337 Apr  8 14:39 quarkus.log

All in one 22 MB binary. Also impressive:

sh-4.2$ cat quarkus.log 
2019-04-08 14:39:02,410 quarkdemo-1-626xd quarkus-quickstart-1.0-SNAPSHOT-runner[7] INFO  [io.quarkus] (main) Quarkus 0.12.0 started in 0.009s. Listening on: http://[::]:8080
2019-04-08 14:39:02,410 quarkdemo-1-626xd quarkus-quickstart-1.0-SNAPSHOT-runner[7] INFO  [io.quarkus] (main) Installed features: [cdi, resteasy, resteasy-jsonb]

That’s a startup time in the ms range! So it makes difference!  Hope you enjoyed that lab!


Run a defined workload on a Docker or Kubernetes environment

Sometimes you want to stress test a container environment or you are measuring CPU and memory in such an environment and you want to test, of your metrics reporting is correct.

Introducing docker-stress

This small tool allows to gauge metrics reporting using the  simple command line utility “stress” inside a docker container.

The needed Dockerfile can be found in this repository:

https://github.com/iboernig/docker-stress/

One can use this tool on a local container host or on a Kubernetes cluster. I will show podman for local deployment and OpenShift for the cluster deployment here.

Local usage with podman (or docker if you wish)

For the local deployment i will use “podman” here. As a proud Fedora user, I use the native and easiest tool that can be used by a normal user with no special rights to work with containers locally. If you need more information to podman have a look here: https://podman.io/.

If you prefer docker to podman, feel free to use docker. the command line is exactly the same.

To start, clone the repository:

[iboernig@t470 Projects]$ git clone https://github.com/iboernig/docker-stress.git
[iboernig@t470 Projects]$ cd docker-stress/

Build locally using podman (you can use “docker” with the same arguments, if you do not have podman)

[iboernig@t470 Projects]$ podman build -t stress .
STEP 1: FROM fedora:latest
STEP 2: RUN yum -y install stress procps-ng 
--> Using cache 8f2c95619aeb7799ae9806fd94d83605f894a458d344659910240092ed7efc4d
STEP 3: FROM 8f2c95619aeb7799ae9806fd94d83605f894a458d344659910240092ed7efc4d
^[[OSTEP 4: ENV CPU_LOAD=1 MEM_LOAD=1 MEM_SIZE=256M
--> Using cache 401365dae085f9a53d39e2eb6a2a14e6b21129d0e19d9f75a16503fc780b2bd5
STEP 5: FROM 401365dae085f9a53d39e2eb6a2a14e6b21129d0e19d9f75a16503fc780b2bd5
STEP 6: CMD stress --cpu $CPU_LOAD --vm $MEM_LOAD --vm-bytes $MEM_SIZE
--> Using cache 8f71320d0ecad024efcbf98be0504eaf3354c08e6469e76a028c6f3b55e0bc95
STEP 7: COMMIT

and then run it:

[iboernig@t470 docker-stress]$ podman run -it -rm stress 
stress: info: [1] dispatching hogs: 1 cpu, 0 io, 1 vm, 0 hdd

You can change the parameters by setting the enviroment variables:

[iboernig@t470 docker-stress]$ podman run -it -rm -e CPU_LOAD=2 -e MEM_LOAD=1 -e MEM_SIZE=512M stress
stress: info: [1] dispatching hogs: 2 cpu, 0 io, 1 vm, 0 hdd

Note that each number of CPU_LOAD and each number of MEM_LOAD allocates one thread. The memory in the variable MEM_SIZE is the size one MEM_LOAD thread consumes. So if you use more than one, you will consume a multiple of MEM_SIZE memory. For more infomation see “man stress”.

Cluster deployment in OpenShift

In OpenShift you only have to define a new app based on this repository:

oc new-app https://github.com/iboernig/docker-stress.git

OpenShift then pulls the repository, starts a docker build and deploys the image in one go.

If you need to tune the parameters you can do so by adding the environment variable to the deplyoment config. Either in the webconsole or by changing the deploymentconfig manually:

oc set env dc/docker-stress CPU_LOAD=2 MEM_LOAD=1 MEM_SIZE=512M

Happy stressing!


Running RHEL on Hetzner hosted servers

Hetzner (http://www.hetzner.de) is a quite popular and affordable server hoster in Germany.

Unfortunately, their automated install procedure supports only Debian, Ubuntu, OpenSUSE or CentOS distributions. As a Red Hat Developer (and Employee) I want to run a real RHEL operating system.

To prepare for the automated installation with the “installimage” tool, we need to prepare an operating system image.

On a local virtual machine, we start with  installing a minimal RHEL server. The following kickstart file can be used for this:

#version=DEVEL
# System authorization information
auth --enableshadow --passalgo=sha512
repo --name="Server-HighAvailability" --baseurl=file:///run/install/repo/addons/HighAvailability
repo --name="Server-ResilientStorage" --baseurl=file:///run/install/repo/addons/ResilientStorage

# Use CDROM installation media
cdrom

# Use graphical install
graphical

# Run the Setup Agent on first boot
firstboot --enable
ignoredisk --only-use=vda

# Keyboard layouts
keyboard --vckeymap=de-nodeadkeys --xlayouts='de (nodeadkeys)','us'

# System language
lang en_US.UTF-8

# Network information
network  --bootproto=dhcp --device=eth0 --ipv6=auto --activate
network  --hostname=localhost.localdomain

# Root password
rootpw --iscrypted <hash>

# System services
services --enabled="chronyd"

# System timezone
timezone Europe/Berlin --isUtc

# System bootloader configuration
bootloader --append=" crashkernel=auto" --location=mbr --boot-drive=vda
autopart --type=lvm

# Partition clearing information
clearpart --none --initlabel

%packages
@^minimal
@core
chrony
kexec-tools
%end

%addon com_redhat_kdump --enable --reserve-mb='auto'
%end

%anaconda
pwpolicy root --minlen=6 --minquality=1 --notstrict --nochanges --notempty
pwpolicy user --minlen=6 --minquality=1 --notstrict --nochanges --emptyok
pwpolicy luks --minlen=6 --minquality=1 --notstrict --nochanges --notempty
%end

Then we boot up the server and log in to change same settings:

  1. The Hetzner tool does only tolerate one kernel in boot, so we need to remove the rescue kernel:
    rm /boot/vmlinuz-0-rescue-adcc72dfe3ed4c049ffff0ec950a90d9
    rm /boot/initramfs-0-rescue-adcc72dfe3ed4c049ffff0ec950a90d9.img
  2.  We need to install the mdadm  utitlity. We could have done it via kickstart, but sometimes you get the information too late ;-):
    subscription-manager register --auto-attach
    yum install -y mdadm
    subscription-manager unregister
  3. Now we can create the image file using tar. Note that we have to exclude the directories /proc /sys and /dev (and the image itsself). Note that we need to name the image “CentOS” and also the version “7.5” in this case needs to be coded into the filename.
    tar cJvf CentOS-75-el-x86_64-minimal.tar.xz --exclude=/dev/* --exclude=/proc/* --exclude=/sys/* --exclude=/CentOS-75-el-x86_64-minimal.tar.xz

Hetzners “installimage” tool will then use these names to decide how the system is adminitrated. “Red Hat” is not known here… Their documentation can be found here:

https://wiki.hetzner.de/index.php/Eigene_Images_installieren

This image now has to retrieved from the VM and saved on a publicly available web server. In my case:

http://boernig.de/CentOS-75-el-x86_64-minimal.tar.xz

Now the Hetzner rescue system can be started and one can log in into system and start the installimage-tool.

You have to chose “Custom-image” in the interactive mode. When you are in the editor choose your disk layout as you like for your purpose, but close the file with the “IMAGE” parameter which points tor your custom build image:

IMAGE http://boernig.de/CentOS-75-el-x86_64-minimal.tar.xz

Then you can save&exit and the automatic installation starts. Do not worry, if the you run into an error, for me the installation failed on the last step: The script tried to install updates, but since the system is not registered yet, this was not possible.

However, the image is there, the kernel in place, grub installed and the network and ssh-keys are set! Just use reboot to boot into the image and you can login!

Don’t forget to disable PasswortLogins in /etc/ssh/sshd_config!

Have fun!


How to add a SSD disk as cache to a given file system on LVM

Today a quick one: I want to add a fast SSD disk as accelerator to a given file system running on software RAID and LVM.

I run a hosted server that has two 3 TB hard drives that operate in software RAID 1 mode:

[root@iboernig-hosted ~]# lsblk
NAME MAJ:MIN RM SIZE RO TYPE MOUNTPOINT
sda 8:0 0 223.6G 0 disk
sdb 8:16 0 2.7T 0 disk 
├─sdb1 8:17 0 512M 0 part 
│ └─md0 9:0 0 511.4M 0 raid1 /boot
├─sdb2 8:18 0 2.7T 0 part 
│ └─md1 9:1 0 2.7T 0 raid1 
│ ├─vg0-root 253:0 0 100G 0 lvm /
│ ├─vg0-swap 253:1 0 20G 0 lvm [SWAP]
│ ├─vg0-home 253:3 0 200G 0 lvm /home
│ └─vg0-var_corig 253:8 0 1T 0 lvm 
│ └─vg0-var 253:2 0 1T 0 lvm /var
└─sdb3 8:19 0 1M 0 part 
sdc 8:32 0 2.7T 0 disk 
├─sdc1 8:33 0 512M 0 part 
│ └─md0 9:0 0 511.4M 0 raid1 /boot
├─sdc2 8:34 0 2.7T 0 part 
│ └─md1 9:1 0 2.7T 0 raid1 
│ ├─vg0-root 253:0 0 100G 0 lvm /
│ ├─vg0-swap 253:1 0 20G 0 lvm [SWAP]
│ ├─vg0-home 253:3 0 200G 0 lvm /home
│ └─vg0-var_corig 253:8 0 1T 0 lvm 
│ └─vg0-var 253:2 0 1T 0 lvm /var
└─sdc3 8:35 0 1M 0 part

As you can see the disks are called /dev/sdb and /dev/sdc respectively. And there is a lot of free space still available.

Additionally the sda disk is 240 GB SSD. Now I want use the SSD as caching device and use half of the capacity as persistent cache for the /var file system.

First of all I have to add the device to the volume group:

$ pvcreate /dev/sda

$ vgextend vg0 /dev/sda

For the next step I have to create two logical volumes, one for the cache data itself and a smaller one for the metadata and make sure that they are created using the /dev/sda physical volume:

$ lvcreate -L 100G -n cachedisk1 vg0 /dev/sda

$ lvcreate -L 4G -n metadisk1 vg0 /dev/sda

Now I create the cachepool and link the cache to the meta data:

$ lvconvert --type cache-pool /dev/vg0/cachedisk1 --poolmetadata /dev/vg0/metadisk1

At a last step I configure the cache for the /var file system:

$ lvconvert --type cache /dev/vg0/var --cachepool cachedisk1

Done:

[root@iboernig-hosted ~]# lvs -a
 LV G Attr LSize  Pool Origin Data% Meta% Move Log Cpy%Sync Convert
 [cachedisk1] vg0 Cwi---C--- 100.00g 0.14 0.16 0.00 
 [cachedisk1_cdata] vg0 Cwi-ao---- 100.00g 
 [cachedisk1_cmeta] vg0 ewi-ao---- 4.00g 
 cachedisk2 vg0 -wi-a----- 100.00g 
 home vg0 -wi-ao---- 200.00g 
 [lvol0_pmspare] vg0 ewi------- 4.00g 
 metadisk2 vg0 -wi-a----- 4.00g 
 root vg0 -wi-ao---- 100.00g 
 swap vg0 -wi-ao---- 20.00g 
 var vg0 Cwi-aoC--- 1.00t [cachedisk1] [var_corig] 0.14 0.16 0.00 
 [var_corig] vg0 owi-aoC--- 1.00t

That was easy! I can see the cache usage and now I can observe things getting faster!

For the record: Tested on Centos 7.4 and RHEL 7.4.

Connecting Kura to Kapua

In the past articles I independently sat up an Eclipse Kapua service using Docker containers and installed Eclipse Kura on a Raspberry Pi. Now its time to connect these and see what happens.

Preparing Kapua

At first, since Kapua is a multi-tenant installation, we need to create an organisation and an admin user in this org.

(I mostly followed the upstream documentation here:  kapua/kuraKapuaDocs.md at develop · eclipse/kapua · GitHub )

After logging into the Kapua webUI using the default admin user “kapua-sys” and password “kapua-password”, we need to create a new tenant or organization.

Unfortunately, tenants in Kapua are called “accounts” which is a little bit confusing (at least for me). Therefore we need to go to “Child Accounts” in left pane and add a new account by pressing “Add” in the upper left corner.

Let’s us as example the account “ACME123”:

Then we press “submit” and click on the new created account.

Before we create a user under this account, we have to change some settings under Settings tab below. Basically every boolean setting has to be set on true except “TagService”. Every other setting should not be changed.

In the users tab, we now can add a User:

  • Username: user123
  • Password: Kapu@12345678

The password needs to have at least 12 characters, with special characters, upper and lowercase and numbers. Because this is used in devices it should not be to easy to guess in a real world scenario.

The should now be created and we need to give this user some rights. For this, we have to switch from the master account to new ACME123 account. This can be done in the upper right corner using “Switch Accounts”.

Now we can go to the “Users” view and select the user123 user.

In the lower part we have “Role” and “Permissions” tabs.

In the “Role” tab, we add the “admin” role. After that we go to “Permissions” and grant all rights to the user.

Now we have everything ready in Kapua to connect!

Configuring Kura to connect to Kapua

After setting up Kura as described in Installing and running Eclipse Kura on a Raspberry Pi B (Model 1) ,

we can edit the cloud configuration settings.

At first we login to the Kura web interface (admin/admin).

Then we got to the “Cloud Service” view and fill in the data under “MqttDataTransport”:

  • Broker URL: mqtt://[IP address of the kapua service]:1883/
  • Topic.context.account-name: ACME123
  • Username: User123
  • Password: Kapu@12345678
  • Client-id: “rpi-1” (this needs to be the same as “device custom-name” in CloudService

Then go to “DataService” and set “connect.auto-on-startup” to true.

All other fields remain unchanged.

Now its time to clck “Connect” and the device is shown as connected,

In Kapua, the newly connected device is now visible under “Devices” and “Connections:

Screenshot Device Management in Kapua


Kura is now fully configured and ready to send some data.

Sending Data to Kapua

As you can see, our data sections Kapua is empty. That is because we did not yet send any data to it. So in this example we will user Example publisher deployment package, which can be obtained from Eclipse marketplace.

This bundle sends some data to provided Cloud (in our case Kapua). We will use it to verify our connection. Click here to visit Example Publisher page.

Click on download button and copy the link address (it has .dp extension) and paste it into Kura -> Packages -> Install/Upgrade -> URL.

Now we need to activate the service:

Click “+” right from search box. Under Factory select org.eclipse.kura.example.publisher.ExamplePublisher, set a Name of your choice and click Apply.

Example publisher then automatically starts sending data to Kapua, which can be verified in kura.log file or in Kapua itself (kura.log file is in on Raspberry Pi in /var/log folder).

Data in Kapua can be observed under “Data”.

This looks very promising and I will continue with the next steps:

  • import Kapua into OpenShift and create a template for an automated deplyment
  • connecting sensors to the Gateway and generate some useful data!

Installing and running Eclipse Kura on a Raspberry Pi B (Model 1)

Now that I have a running Kapua instance, its time to look at the network edge to gateways and devices.

Eclipse Kura is a Java/OSGi-based framework for IoT gateways. A gateway is a devices that is distributed at the network edges and communicates with sensor or steering devices using cables, Bluetooth or other private networks.

Sins Kura supports a rather broad range of small devices, my plan is to use a spare Raspberry Pi as gateway hardware.

Unfortunately my old Raspberry PI B is from the first generation, based on the ARMv6 architecture with 512 MB RAM. Therefore I cannot base the OS on Fedora that needs at least Model 2 and ARMv7 or ARMv8 architecture, so that I need to use Download Raspbian for Raspberry Pi  for this. I choose the small server set and write that to the SD card:

unzip -p 2017-11-29-raspbian-stretch.zip | sudo dd of=/dev/sdX bs=4M conv=fsync status=progress

Now inserting the SD card into the Pi, connecting LAN and booting. By default, ssh is disabled so I had to connect a keyboard and monitor and do that manually.

Login as user “pi”, password: “raspberry” (this should be changed asap!)

systemctl enable ssh.service
systemctl start ssh.service
hostname -I

(this will give you the IP address where to connect to.

Now the fun can begin. I typically copy my ssh-key and login from my workstation:

ssh-copy-id ~/.ssh/id_rsa.pub pi@<ip_of_pi>
ssh pi@<ip_of_pi>

Now its time to install Eclipse Kura! Get the latest version from here. Since I have the old Raspberry model I choose this one.  For the installation I mainly followed the Raspberry Pi Quick Start documentation but I will show the steps here, too.

After booting the Pi several steps are needed on the Raspbian OS: At first, the dhcpcd5 packages needs to be removed:

sudo apt-get purge dhcpcd5

then its useful to install the gdebi command tool to find all dependencies needed:

sudo apt-get update
sudo apt-get install gdebi-core

And finally install Java:

sudo apt-get install openjdk-8-jre-headless

Finally, the package can be downloaded and installed:

wget http://download.eclipse.org/kura/releases/<version>/kura_<version>_raspberry-pi-2-3_installer.deb

Note: replace <version> in the URL above with the version number of the latest release (e.g. 3.1.1). Install Kura with:

sudo gdebi kura_<version>_raspberry-pi-2-3_installer.deb

Since Kura will make use of a wifi card to connect to devices, I also inserted a wifi dongle. And now its time for a reboot!

Kura starts up automatically and presents a web UI:

http://<ip-of-pi>
Username: admin

Password: admin
Eclipse kura screenshot
Screenshot from Eclispe kura running on Raspberry Pi B

That’s it! Stay tuned for the next part: Connecting Kura to the central Kapua instance.

Creating a standalone instance of Eclipse Kapua using Docker containers

Today I start with taking a deeper look at Eclipse Kapua. It is a modular IoT cloud platform to manage and integrate devices and their data.

My goal for the next weeks will be to demonstrate a multi-tenant capable installation of Eclipse Kapua on OpenShift, connecting several IoT devices and gateways to it.

As a first step, I will setup Kapua as a standalone application using pre-built docker containers.

Then I will use a raspberry pi running Eclipse Kura to connect to Kapua and send test data.

Next steps will be the port to OpenShift making use of persistent storage and scalability. And connecting sensors to the raspberry pi gateways to send  some useful data.

Setting up Kapua if you have a running docker service is fairly easy:

You need to have a 64bit architecture, Docker version > 1.2, roughly 8 GB of free RAM and access to the internet to fetch the pre-built containers from docker hub.

docker run -td --name kapua-sql -p 8181:8181 \
    -p 3306:3306 kapua/kapua-sql:0.3.2
docker run -td --name kapua-elasticsearch \
    -p 9200:9200 -p 9300:9300 elasticsearch:5.4.0 \
   -Ecluster.name=kapua-datastore \
   -Ediscovery.type=single-node \
   -Etransport.host=_site_ \
   -Etransport.ping_schedule=-1 \
   -Etransport.tcp.connect_timeout=30s
docker run -td --name kapua-broker --link kapua-sql:db \
    --link kapua-elasticsearch:es \
   --env commons.db.schema.update=true \
   -p 1883:1883 -p 61614:61614 kapua/kapua-broker:0.3.2
docker run -td --name kapua-console --link kapua-sql:db \
    --link kapua-broker:broker \
   --link kapua-elasticsearch:es \
   --env commons.db.schema.update=true \
   -p 8080:8080 kapua/kapua-console:0.3.2
docker run -td --name kapua-api --link kapua-sql:db \
    --link kapua-broker:broker \
   --link kapua-elasticsearch:es \
   --env commons.db.schema.update=true \
   -p 8081:8080 kapua/kapua-api:0.3.2

Each line will then fetch the container and start them.

In order to make the service accessible, I also add some firewall rules on my docker host:

firewall-cmd --add-port 8080/tcp
firewall-cmd --add-port 8081/tcp
firewall-cmd --add-port 1883/tcp

Thats all. Now you can acces the Kapua Web GUI on

http://<ip_of_docker_host>:8080

Screenshot of Eclipse Kapua Web UI

The default credentials are:

Username: kapua-sys

Password: kapua-password

Additionally there is a message broker running at

tcp://<ip_of_docker_host>:1883
Username: kapua-broker

Password: kapua-password

And a RESTful API under

http://<ip_of_docker_host>:8081/doc
Username: kapua-sys

Password: kapua-password

That really was easy. Lets see what we can do with it. Stay tuned for the next part: Installing Eclipse kura on a Raspberry Pi.

An Internet of Threads or will there also be Something in Open Source?

Currently I play with IoT devices and connected “things”, and as much they fascinate me, mostly they are quite locked and when the vendor loses interest, money or disappears from the market, these things mutate to ubiquitous threads and begin to scare me.

Sure, most of the stuff is built on Linux, but passwords or access is blocked and if there is no merciful vendor that takes care of automated updates they rot and become vulnerable.

Additionally, sometimes even the communication protocols are unknown, insecure and create a lock-in to the original vendor and its “intellectual property”.

In an ideal world there will be an Open Source based software stack that is capable of a standard based communication, secured connection with controlled data flow and ways to manage the zillions of devices connected to and managed by the central management.

And, although the world is not perfect, something like this seems to exist: In the Eclipse community, there is the IoT Community!

I specifically looked into the IoT device middleware Kura  and the cloud based management platform Kapua.

With these tools and a secure MQTT based communication, an Open Source, standards based IoT stack can created:

Eclipse IoT Stack

This not pure academic stuff, but real code! Interesting companies like Eurotech, Bosch and my employer Red Hat are investing into these projects.

My goal in the coming weeks will be to look deeper into these projects, make them available in an on-premise installation and have a lot of fun. And yes, I will write about that here. So stay tuned.